
Understanding Cleanliness in Indian Cities
The Swachh Survekshan, conducted annually by India’s Ministry of Housing and Urban Affairs, ranks cities based on cleanliness, waste management, sanitation, and citizen participation. In 2024, over 4,000 cities were evaluated, with parameters like waste segregation (35% weight), sanitation infrastructure (30%), and public feedback (35%). As of 2026, India’s urban cleanliness has improved, with 70% of cities achieving 80% waste segregation, up from 50% in 2019.
Top 10 Cleanest Cities in India 2026
1. Indore, Madhya Pradesh
Rank: 1 (Swachh Survekshan 2024)
Population: 2.8 million
Key Metrics: 100% door-to-door waste collection, 1,200 tons of waste processed daily, AQI 60-80.
Details: Indore has topped the cleanliness ranking for eight years, driven by robust waste management systems, including 600 waste collection vehicles and 15 waste-to-energy plants. Public campaigns engage 90% of residents in segregation, with 95% of waste recycled or composted. The city’s clean streets and green spaces, like Rajwada, attract eco-conscious tourists.

2. Surat, Gujarat
Rank: 2
Population: 7.2 million
Key Metrics: 98% waste segregation, 2,000 tons of waste processed daily, AQI 70-90.
Details: Surat’s transformation from a 1994 plague-hit city to a cleanliness leader involves 1,500 daily cleaning staff and 20 waste processing units. The city’s riverfront and textile markets are kept spotless, with 85% of waste converted to energy or compost.
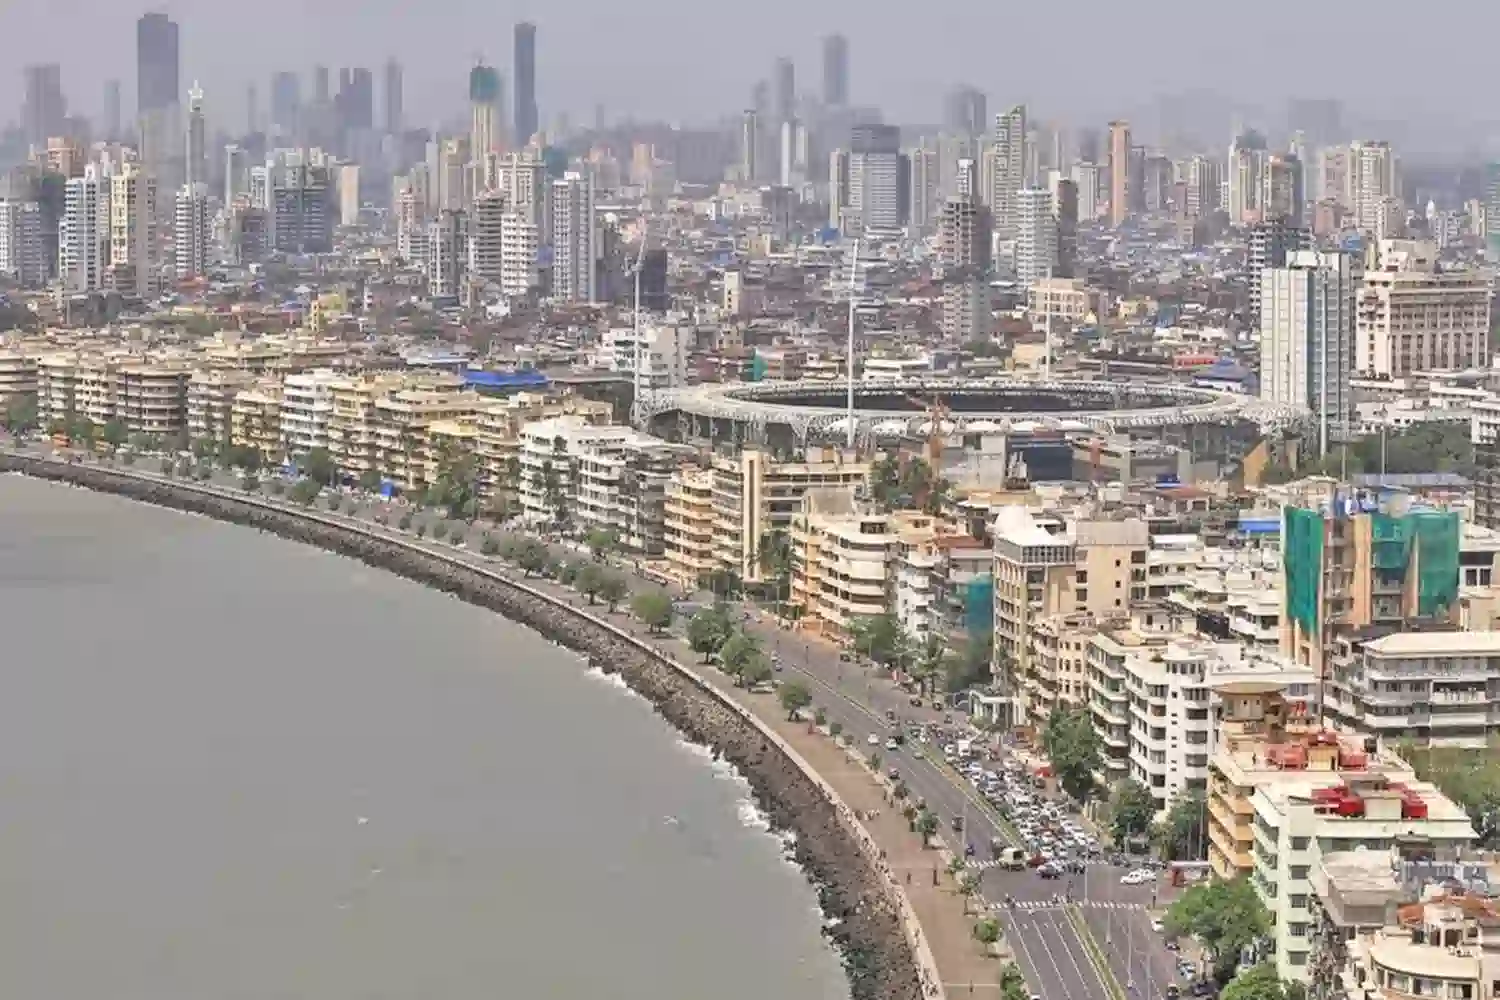
3. Navi Mumbai, Maharashtra
Rank: 3
Population: 1.8 million
Key Metrics: 95% sanitation coverage, 800 tons of waste processed daily, AQI 50-70.
Details: Planned urban design and strict waste management policies ensure cleanliness. Navi Mumbai’s 10 composting plants and green belts, like Kharghar Hills, maintain low pollution levels, with 90% resident participation in cleanliness drives.
4. Visakhapatnam, Andhra Pradesh
Rank: 4
Population: 2.3 million
Key Metrics: 92% waste segregation, 1,100 tons of waste processed daily, AQI 60-85.
Details: Known for its beaches, Visakhapatnam employs 1,200 workers for coastal and urban cleaning. Its 5 waste-to-energy plants process 80% of waste, and public campaigns ensure 85% sanitation coverage.
5. Bhopal, Madhya Pradesh
Rank: 5
Population: 2.4 million
Key Metrics: 90% waste collection, 1,000 tons of waste processed daily, AQI 65-80.
Details: Bhopal’s lake conservation and 12 composting units maintain cleanliness. The city’s green initiatives, like Van Vihar, support eco-tourism, with 88% of residents engaged in waste segregation.
6. Ahmedabad, Gujarat
Rank: 6
Population: 8.1 million
Key Metrics: 93% sanitation coverage, 2,500 tons of waste processed daily, AQI 80-100.
Details: Ahmedabad’s Sabarmati Riverfront and 15 waste processing plants ensure cleanliness. Smart city initiatives and 90% resident participation keep streets clean, supporting heritage tourism.
7. Chandigarh
Rank: 7
Population: 1.2 million
Key Metrics: 100% door-to-door collection, 500 tons of waste processed daily, AQI 40-60.
Details: Chandigarh’s planned layout and 8 composting plants maintain low AQI. Green spaces like Rock Garden and 95% sanitation coverage make it a model city.
8. Mysuru, Karnataka
Rank: 8
Population: 1.3 million
Key Metrics: 90% waste segregation, 600 tons of waste processed daily, AQI 50-70.
Details: Mysuru’s heritage sites, like Mysore Palace, are kept clean through 10 composting units and 80% resident participation. The city’s ban on single-use plastics reduces waste by 15%.
9. Tirupati, Andhra Pradesh
Rank: 9
Population: 0.8 million
Key Metrics: 95% sanitation coverage, 400 tons of waste processed daily, AQI 55-75.
Details: Tirupati’s temple-driven tourism demands cleanliness, with 5 waste-to-energy plants and 90% waste segregation. Pilgrim engagement ensures clean streets.
10. New Delhi (NDMC Area)
Rank: 10
Population: 0.3 million (NDMC area)
Key Metrics: 98% waste collection, 300 tons of waste processed daily, AQI 80-100.
Details: The NDMC area, including Connaught Place, uses smart waste systems and 8 composting units. Green initiatives and 85% sanitation coverage maintain cleanliness.
Comparative Cleanliness Statistics Table
| City | Swachh Survekshan Rank | Waste Processed Daily (Tons) | Waste Segregation (%) | AQI Range |
|---|---|---|---|---|
| Indore | 1 | 1,200 | 100 | 60-80 |
| Surat | 2 | 2,000 | 98 | 70-90 |
| Navi Mumbai | 3 | 800 | 95 | 50-70 |
| Visakhapatnam | 4 | 1,100 | 92 | 60-85 |
| Bhopal | 5 | 1,000 | 90 | 65-80 |
| Ahmedabad | 6 | 2,500 | 93 | 80-100 |
| Chandigarh | 7 | 500 | 100 | 40-60 |
| Mysuru | 8 | 600 | 90 | 50-70 |
| Tirupati | 9 | 400 | 95 | 55-75 |
| New Delhi (NDMC) | 10 | 300 | 98 | 80-100 |
Factors Driving Cleanliness
- Waste Management: Indore’s 100% segregation and 15 waste-to-energy plants set a benchmark, processing 95% of waste sustainably.
- Sanitation Infrastructure: Chandigarh’s 100% sanitation coverage includes 2,000 public toilets, reducing open defecation to 0%.
- Public Participation: Surat’s 85% resident involvement in cleanliness drives ensures community accountability.
- Green Initiatives: Bhopal’s lake conservation and 10,000 tree plantations reduce AQI by 10% annually.
- Technology Integration: Ahmedabad’s smart waste tracking systems monitor 2,500 tons of daily waste, improving efficiency by 20%.
Qualitative Insights: Community Perspectives
In Indore, a resident noted, “Our city feels like home because everyone segregates waste.” A Surat shopkeeper said, “Clean streets attract more customers, boosting our economy.” In Chandigarh, a student shared, “Green spaces inspire us to keep the city clean.” These voices highlight the cultural shift towards cleanliness driven by community pride.
Challenges in Maintaining Cleanliness
- Population Density: Surat’s 7.2 million residents generate 2,000 tons of waste daily, straining systems.
- Urban Sprawl: Ahmedabad’s rapid growth challenges waste infrastructure, with 15% of outskirts lacking coverage.
- Tourism Pressure: Tirupati’s 50,000 daily pilgrims increase litter, requiring 200 extra workers during festivals.
- Air Pollution: New Delhi’s AQI spikes to 100 due to traffic, despite clean NDMC areas.
Impact of Cleanliness on Tourism
Clean cities like Mysuru and Visakhapatnam attract 30% more tourists annually, boosting local economies by 15%. Indore’s clean markets and Chandigarh’s green spaces draw eco-conscious travelers, with 80% of visitors citing cleanliness as a key factor. Jaynevy Tours offers curated trips to explore these cities’ cultural and natural attractions.
Future Trends and Initiatives
By 2030, India aims for 100% waste segregation in 80% of cities, with 500 new waste-to-energy plants planned. Indore’s model is being replicated in 200 cities, and Surat’s AI-based waste monitoring is expanding. Citizen apps, used by 60% of urban residents, enhance reporting of litter, improving response times by 25%.
Explore Tanzania’s Natural Beauty
While India’s clean cities inspire urban sustainability, Tanzania offers pristine natural landscapes. Visit Mount Kilimanjaro, Zanzibar beaches, or Serengeti safaris with Jaynevy Tours to experience eco-friendly travel. Plan your adventure today!
Frequently Asked Questions
Which is the cleanest city in India in 2026?
Indore has been ranked the cleanest city in India for eight consecutive years, as per Swachh Survekshan 2024.
What is Swachh Survekshan?
Swachh Survekshan is an annual survey by India’s Ministry of Housing and Urban Affairs, ranking cities based on cleanliness, waste management, and sanitation.
What factors contribute to a city’s cleanliness ranking?
Factors include waste management, sanitation facilities, air quality, public awareness, and infrastructure for sustainable practices.
How does Indore maintain its cleanliness?
Indore employs door-to-door waste collection, 100% waste segregation, and public awareness campaigns, processing 1,200 tons of waste daily.
Can tourists visit these clean cities in India?
Yes, cities like Indore, Surat, and Navi Mumbai offer clean environments and tourist attractions, ideal for eco-conscious travelers.