
Assessing Global Military Power
Military strength is evaluated through metrics like defense budgets, active personnel, technological advancements, and global influence. In 2026, nations with significant investments in defense dominate the rankings (Global Firepower, 2024). This guide explores the top 10 militaries, their capabilities, and their impact on global security and tourism.
Top 10 Most Powerful Militaries in 2026
1. United States
Quantitative Data: Defense budget: $886 billion. Active personnel: 1.4 million. Aircraft: 13,300. Naval vessels: 460. Nuclear warheads: 5,244.
Qualitative Insight: The US leads with advanced technology (F-35 jets, drones) and global bases (800+). Its Navy’s 11 aircraft carriers ensure unmatched power projection. X posts highlight US military museums as tourist attractions.

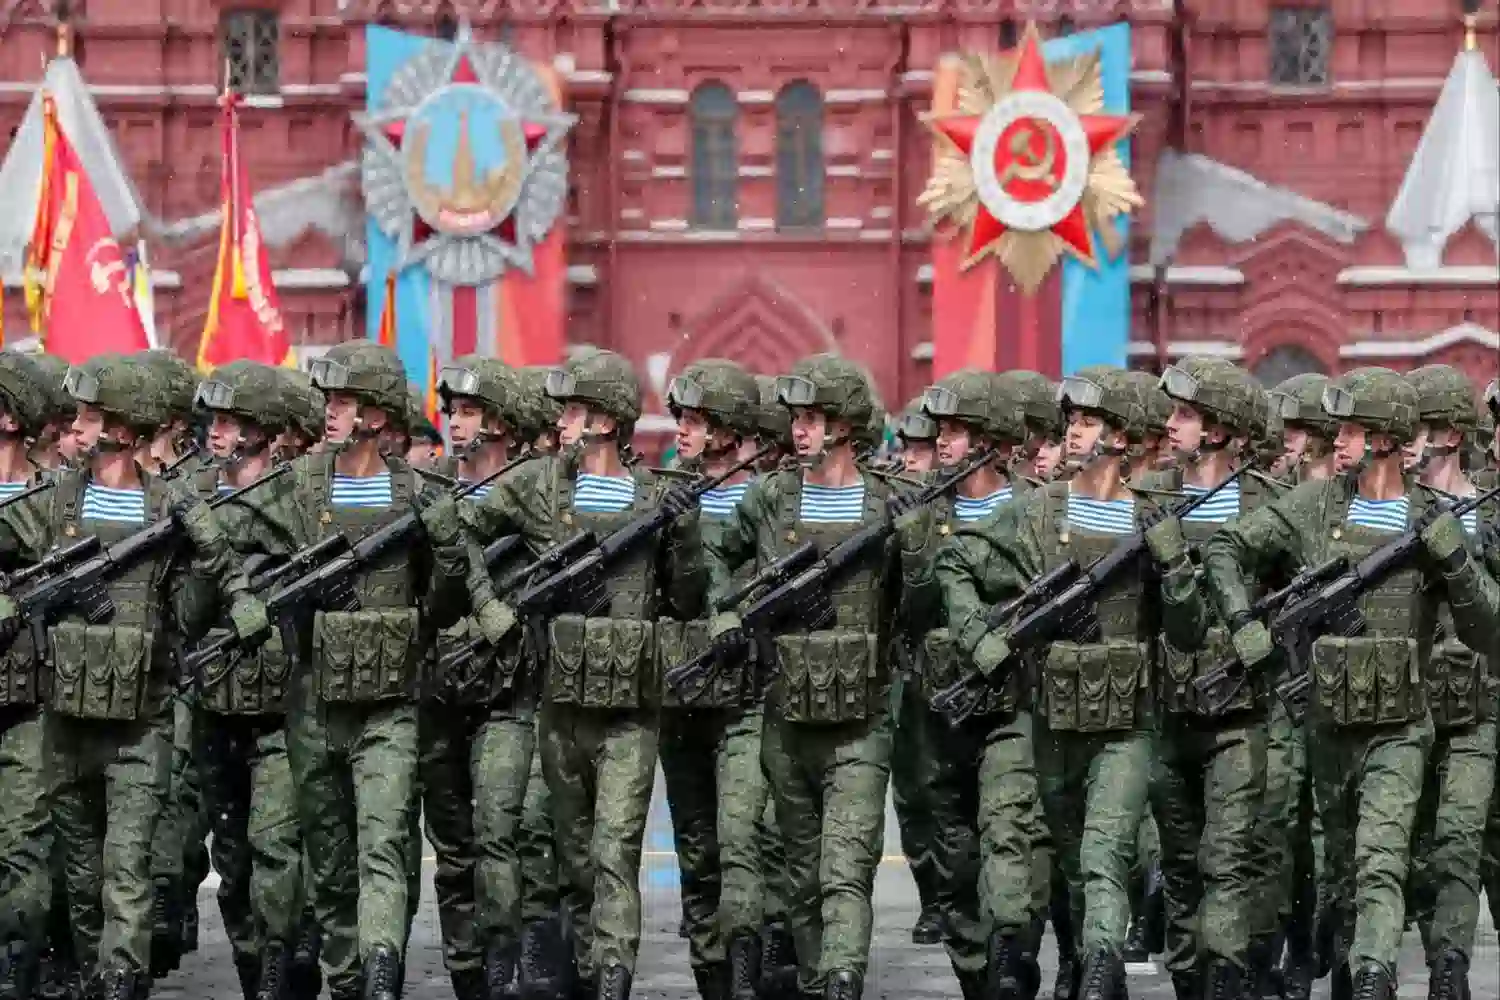
2. Russia
Quantitative Data: Budget: $84 billion. Active personnel: 1.1 million. Tanks: 12,000. Nuclear warheads: 5,889.
Qualitative Insight: Russia’s strength lies in its vast tank fleet and nuclear arsenal. Modernization efforts focus on hypersonic missiles, but economic sanctions limit progress. X discussions note Russia’s Red Square military parades as tourist draws.
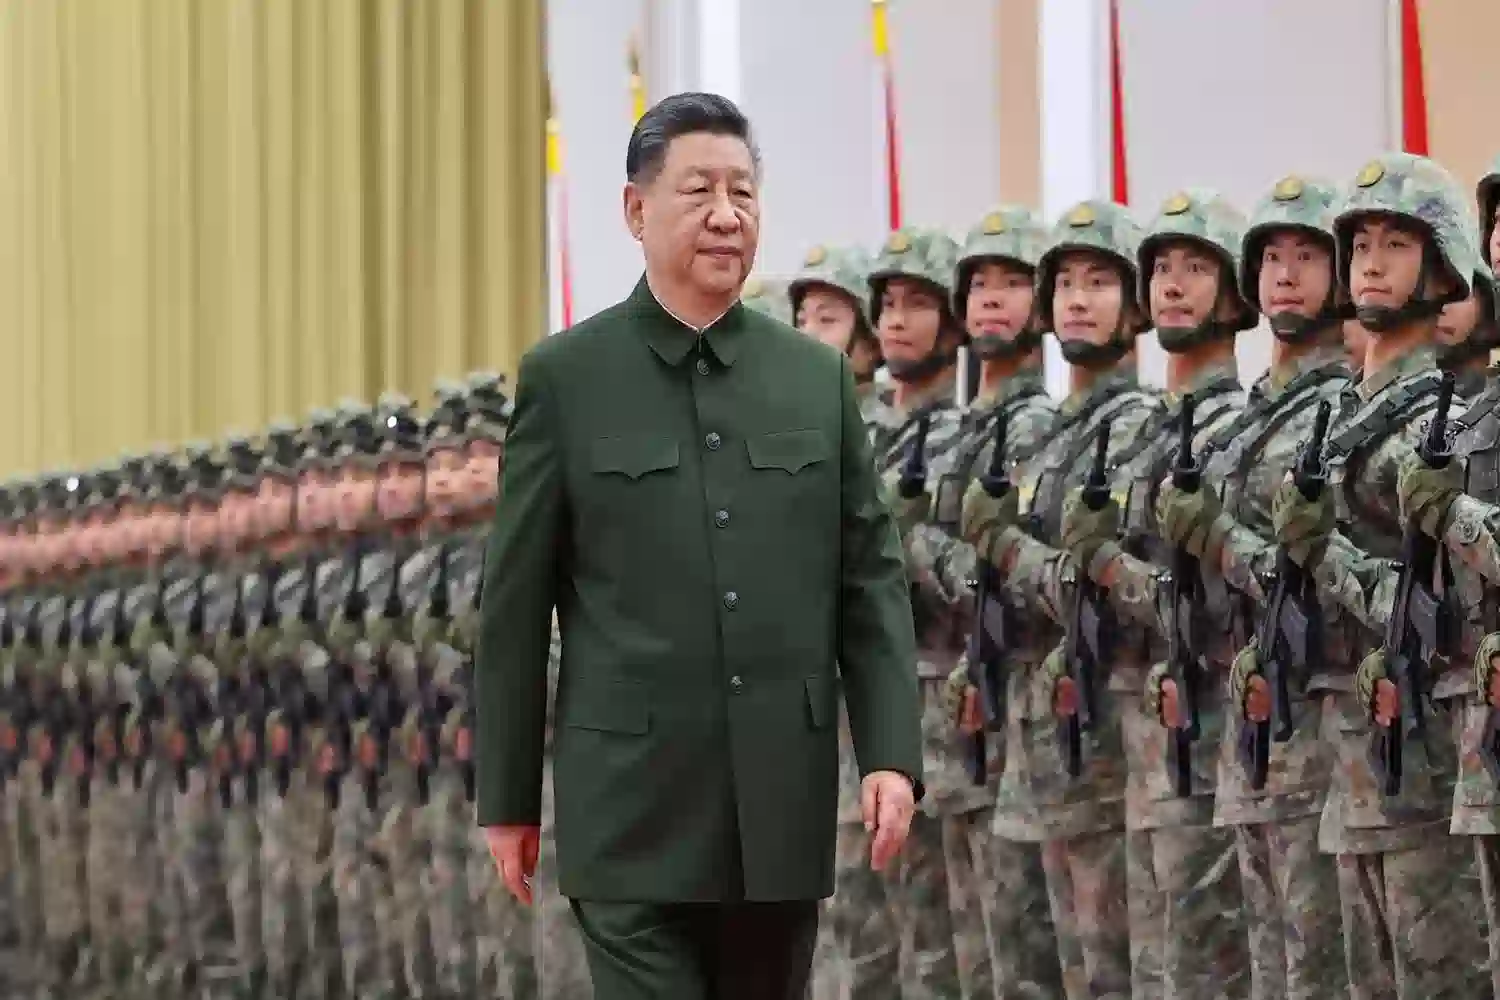
3. China
Quantitative Data: Budget: $296 billion. Active personnel: 2 million. Naval vessels: 730. Aircraft: 3,300.
Qualitative Insight: China’s large personnel and growing navy (3 aircraft carriers) are strengths, but it lags in stealth technology. X posts highlight China’s military modernization and Great Wall tours.
4. India
Quantitative Data: Budget: $81 billion. Active personnel: 1.4 million. Aircraft: 2,200. Tanks: 4,600.
Qualitative Insight: India’s growing defense industry and nuclear capabilities boost its rank. Border tensions drive investments. X users mention military history tours in Delhi.

5. United Kingdom
Quantitative Data: Budget: $68 billion. Active personnel: 194,000. Naval vessels: 70. Aircraft: 660.
Qualitative Insight: The UK’s advanced tech (Queen Elizabeth-class carriers) and NATO role enhance its power. X posts praise London’s Imperial War Museum for tourists.

6. France
Quantitative Data: Budget: $56 billion. Active personnel: 203,000. Aircraft: 1,000. Nuclear warheads: 290.
Qualitative Insight: France’s global presence and Rafale jets strengthen its military. X discussions highlight military history tours in Normandy.

7. Japan
Quantitative Data: Budget: $46 billion. Active personnel: 247,000. Naval vessels: 140. Aircraft: 1,400.
Qualitative Insight: Japan’s advanced tech and maritime focus counter regional threats. X posts note Hiroshima’s peace memorials as tourist attractions.

8. South Korea
Quantitative Data: Budget: $50 billion. Active personnel: 500,000. Tanks: 2,600. Aircraft: 1,600.
Qualitative Insight: South Korea’s modern equipment and mandatory conscription ensure readiness. X users highlight DMZ tours as unique experiences.

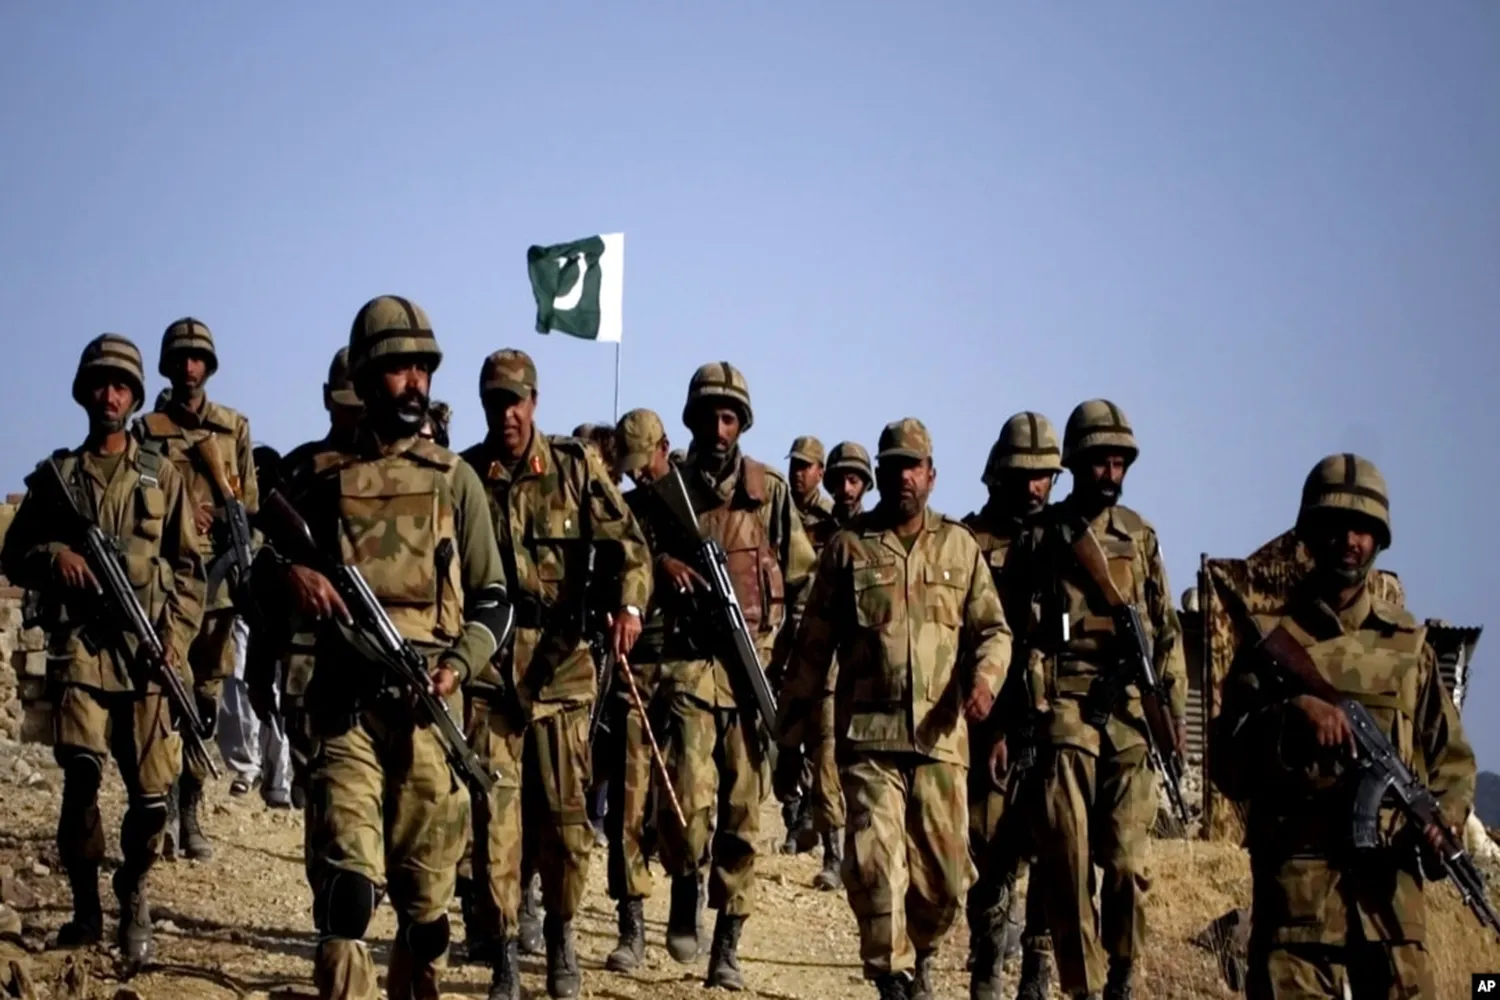
9. Pakistan
Quantitative Data: Budget: $13 billion. Active personnel: 654,000. Aircraft: 1,400. Nuclear warheads: 170.
Qualitative Insight: Pakistan’s nuclear arsenal and large army counter regional threats. X posts mention military history sites in Lahore.
10. Israel
Quantitative Data: Budget: $24 billion. Active personnel: 170,000. Aircraft: 600. Tanks: 2,200.
Qualitative Insight: Israel’s advanced tech (Iron Dome) and mandatory conscription ensure strength. X discussions note military museums in Tel Aviv.

Military Strength Comparison Table
| Country | Budget ($B) | Personnel (M) | Aircraft | Vessels | Nukes |
|---|---|---|---|---|---|
| United States | 886 | 1.4 | 13,300 | 460 | 5,244 |
| Russia | 84 | 1.1 | 4,200 | 600 | 5,889 |
| China | 296 | 2.0 | 3,300 | 730 | 410 |
| India | 81 | 1.4 | 2,200 | 140 | 164 |
| United Kingdom | 68 | 0.194 | 660 | 70 | 225 |
| France | 56 | 0.203 | 1,000 | 90 | 290 |
| Japan | 46 | 0.247 | 1,400 | 140 | 0 |
| South Korea | 50 | 0.5 | 1,600 | 150 | 0 |
| Pakistan | 13 | 0.654 | 1,400 | 100 | 170 |
| Israel | 24 | 0.17 | 600 | 60 | 90 |
Factors Contributing to Military Strength
- Defense Budget: The US’s $886 billion budget dwarfs others, enabling advanced tech and global operations.
- Personnel: China’s 2 million active personnel provide numerical superiority.
- Technology: US and Israel lead in drones, cyber warfare, and missile defense systems.
- Nuclear Capabilities: Russia and the US dominate with over 5,000 warheads each.
- Global Influence: NATO membership boosts UK and France’s strategic reach.
Challenges and Limitations
High budgets don’t guarantee efficiency; Russia faces logistical issues, as seen in Ukraine conflicts. China’s navy lacks global experience compared to the US. Smaller nations like Israel rely on technology due to limited personnel. X posts note debates on military spending vs. social welfare.
Military Tourism Opportunities
Countries with strong militaries offer unique tourism experiences. The US’s National Museum of the Marine Corps, UK’s Imperial War Museum, and South Korea’s DMZ tours attract visitors. Tanzania, while not a military power, offers safe safari tours, Mount Kilimanjaro, Serengeti National Park , Zanzibar and Ngorongoro Crater , appealing to travelers interested in global stability. Contact Jaynevy Tours for tailored itineraries.
Frequently Asked Questions
Which country has the most powerful military in 2026?
The United States has the most powerful military, with a $886 billion budget and advanced technology.
What factors determine military strength?
Budget, personnel, technology, logistics, and global influence determine military power.
How does China's military compare to the US?
China has a larger active personnel force (2 million) but lags in technology and global reach.
Which countries have nuclear capabilities?
US, Russia, China, UK, France, India, Pakistan, and North Korea have nuclear arsenals.
How does military power impact tourism?
Strong militaries ensure safety, boosting tourism in countries like the US and UK.